

Although Maryland’s population increased nearly 7% between 2010 and 2020, population growth on the Mid-Shore was virtually stagnant. Queen Anne’s County accounted for most of the growth in the last decade; Kent County’s population decline was the highest in the region.
Census population numbers are used to “determine the number of seats each state has in the U.S. House of Representatives and is also used to distribute hundreds of billions of dollars in federal funds to local communities,” according to the U.S. Census Bureau.
The numbers are also used to draw state legislative districts and county-level districts for county council or commission and board of education where those seats are elected by district.
While much of the focus is on the congressional and state legislative districts, the 2020 population figures may require some small adjustments for county-level seats that are elected from districts.
Queen Anne’s County, with 2,000 more residents, likely will require the most adjustments for its county commission and school board seats, depending on where the new residents are distributed. Kent County does not elect members from districts for county commission or school board and will not need to make any adjustments despite losing nearly 1,000 residents.
Mid-Shore public bodies with districts include:
Caroline County — board of education, three districts;
Dorchester County — county council, five districts; board of education, five districts;
Queen Anne’s County — county commissioners, four districts, one at-large; board of education, four districts, one at-large;
Talbot County — board of education, seven districts.
The biggest battles will occur with the congressional and state legislative district maps. Maryland’s current congressional map is considered one of the most gerrymandered in the nation. Gov. Martin O’Malley and Democratic lawmakers packed Democratic areas into a western Maryland district that had repeatedly elected a Republican to Congress. The mapping process following the 201o Census also put more Republicans into the First District, which encompasses the Eastern Shore.
As a result, Maryland’s congressional representation went from six Democrats and two Republicans to seven Democrats and one Republican (the First District’s Andy Harris).
Two redistricting commissions — one appointed by Gov. Larry Hogan and another by Maryland legislative leaders — are already at work on the maps for the congressional and legislative district maps.
The state planning department offers adjusted redistricting data on its website, which also includes a link to a mapping web portal through which anyone may submit proposed redistricting maps for review by the Maryland Citizens Redistricting Commission appointed by Hogan.
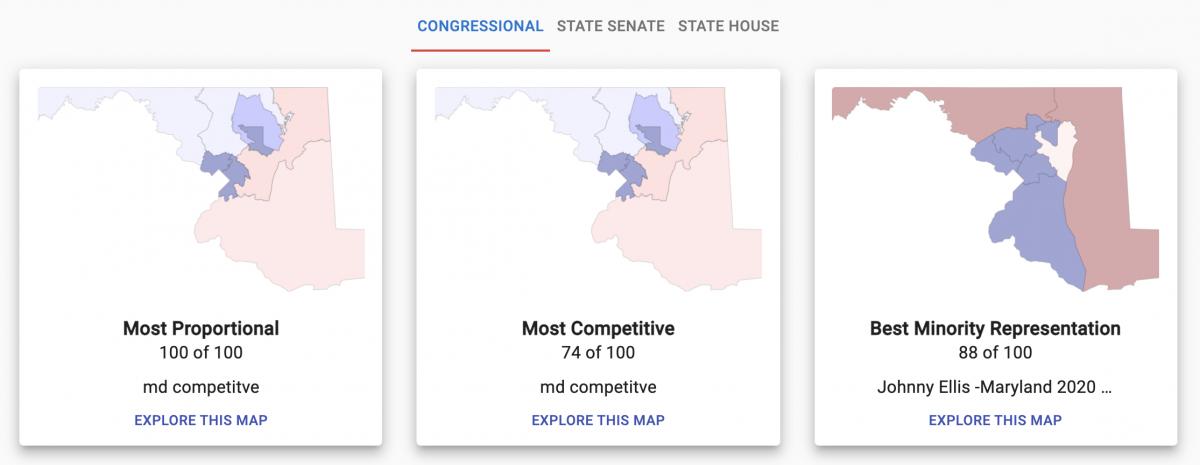
Outside groups also have offered maps, with several available to view at Dave’s Redistricting, “a free web app to create, view, analyze and share redistricting maps for all 50 states and the District of Columbia, according to the site.
The website offers five notable maps — most proportional, most competitive, best minority representation, most compact, and least splitting — for congressional, state senate, and state house redistricting plans.
At presstime, the notable congressional maps for proportionality, competitiveness, and compactness would split the Eastern Shore into two districts. The First Congressional District currently includes the entire Eastern Shore from Cecil to Worcester county and portions of Harford, Baltimore, and Carroll counties.
The current most proportional and most competitive congressional map would create a district that includes Queen Anne’s to Worcester county on the Eastern Shore, the southern Maryland counties of Calvert, Charles, and St. Mary’s, and a portion of Prince George’s County. That district is seen in yellow below.
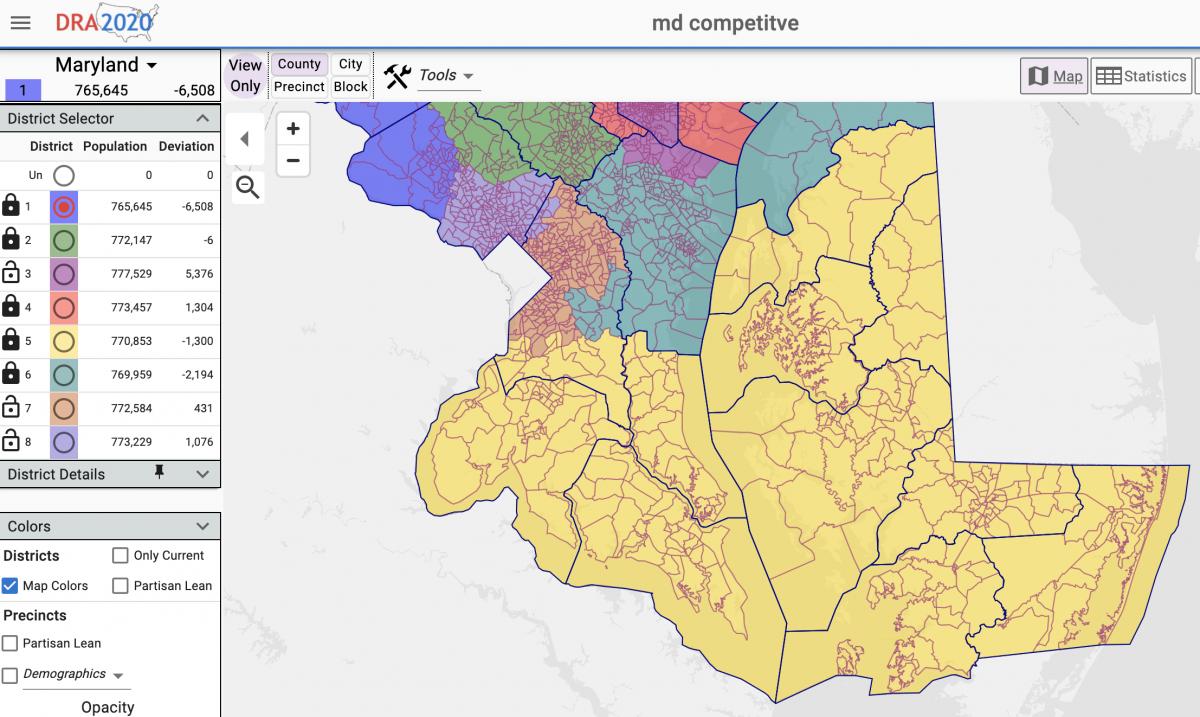
The most proportional and most competitive Maryland congressional district maps published thus far would include seven Eastern Shore counties, three southern Maryland counties, and a portion of Prince George’s County. Screenshot from Dave’s Redistricting.
The most compact congressional map has a district that includes Kent to Worcester county, the three southern Maryland counties, and portions of Prince George’s and Anne Arundel counties. That district is seen in light purple below.
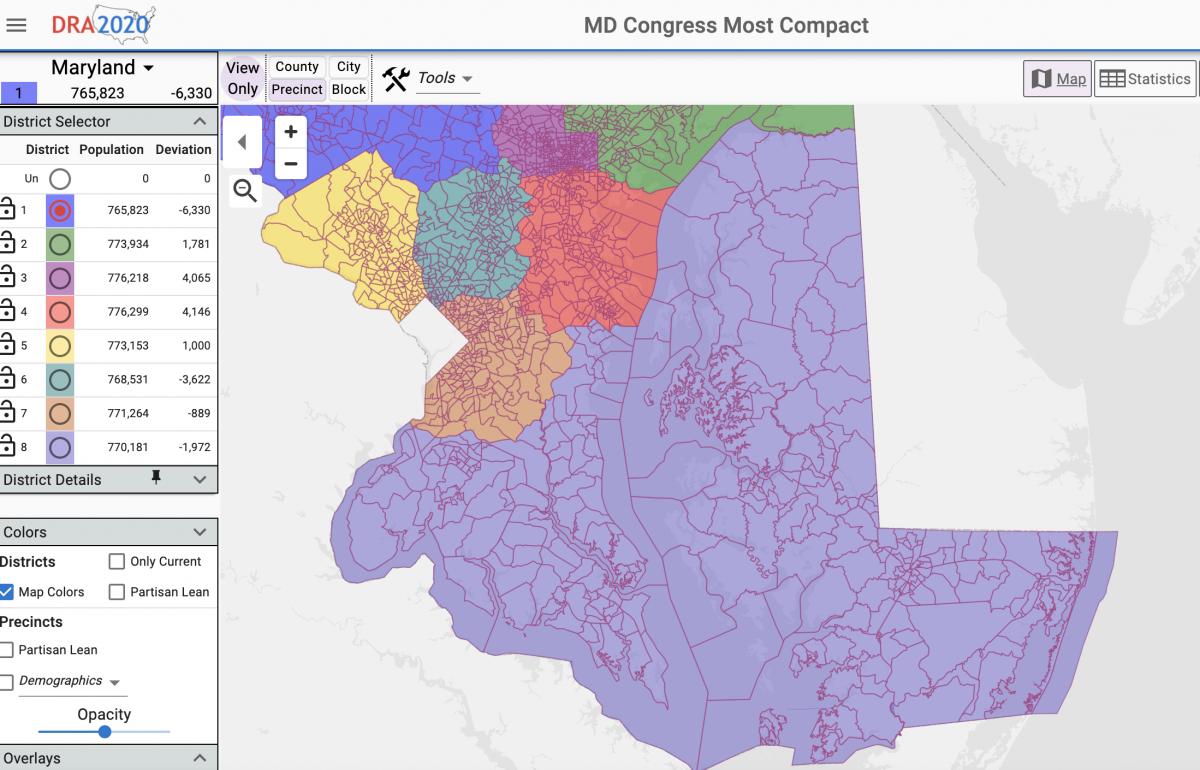
The most compact Maryland congressional district maps published thus far would include eight Eastern Shore counties, three southern Maryland counties, and portions of Prince George’s and Anne Arundel counties. Screenshot from Dave’s Redistricting.
Write a Letter to the Editor on this Article
We encourage readers to offer their point of view on this article by submitting the following form. Editing is sometimes necessary and is done at the discretion of the editorial staff.