


Last Monday the Maryland State Department of Education released new School Progress Index scores for school performance during the FY 11-12 academic year.
Using the new Accountability Program, which evaluates individual schools on school progress, the new School Progress Index (SPI), as well as differentiated recognition, the results show Queen Anne’s County Schools maintaining its reputation as one of best performing school districts in the state, while Kent County continues to show significant gaps with most of their schools, and Talbot County falls between the two.
The new tests were designed to remove many of the more controversial testing criteria associated with the “No Child Left Behind” education initiative, and to provide more accurate indicators on a school’s progress on proficiency in core areas like math and reading.
Under this new system, Maryland has adopted a goal of cutting in half the number of students in each school who are not achieving at the proficient level based on multiple indicators, and Annual Measureable Objectives that are based on each school’s history. These indicators are compared to the school’s progress targets and are combined to generate a School Progress Index (SPI) for every school.
The SPI is an estimate of the extent to which the school has met its targets. The indicators that these targets address are achievement, gap reduction and growth at the elementary levels and achievement, gap reductions, and college and career readiness at the high school level. SPI is an accountability system that helps educators evaluate how well a school is progressing in its quest to improve student performance.
The yardstick for every school is set against its own ability to reduce in half, within six years, the portion of students who did not achieve proficiency. These annual improvement targets are set for every school individually. A school progressing as expected will achieve an SPI score of 1 or better.
The SPI is compensatory by design, so that a low value in one indicator can be balanced by a high indicator on another. To more accurately identify school progress in the three main indicators for that school level, the state also assigns the school to a “strand.” A strand rating of 1 to 5 is designated based upon the school’s SPI and its success in meeting each of the individual indicators.
In order to be classified as a “Strand 1” school, the school must have scored a 1.0 or better for SPI and must have met all three of the indicators for that school level. The Indicator information, overall SPI score, and Strand taken together will help our school leaders focus their attention on the areas of greatest need.
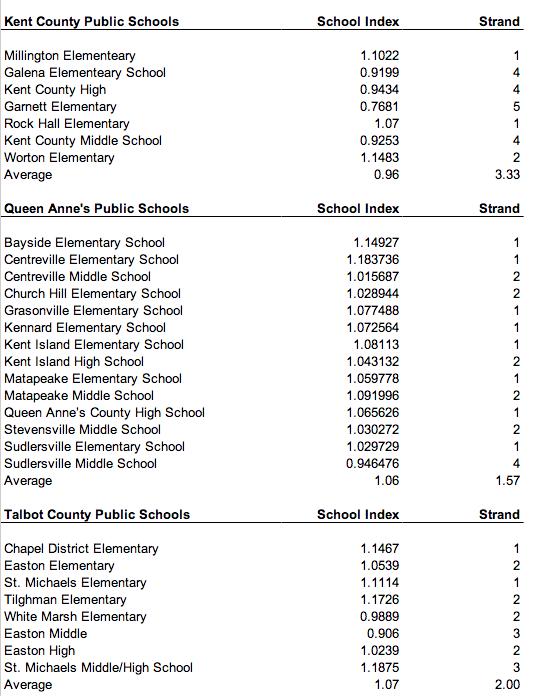
As a school system, Queen Anne’s County Public Schools scored a 1.0449 for an SPI. Thirteen of our schools scored above the 1.0 level on for SPI, with Sudlersville Middle school scoring only a 0.9465. It should be noted that this is just slightly below the state average for middle schools (0.9562). Queen Anne’s County were assigned to Strand 1, five schools were assigned to Strand 2, with only one school assigned to Strand 4.
Kent County on the other hand scored an average of 0.96 on the SPI and saw and average of 3 for strand measurements. Worton Elementary showed the greatest progress with a index school or 1.14, with Millington Elementary and Rock Hall Elementary achieving the highest strand rating of 1. Garnett Elementary showed very poor SPI results of .76 and Strand category of 5, which are considered to be the lowest-progressing schools in the State
And Talbot County found itself in the middle of the three counties with SPI scores averaging 1.07 and and average Strand rating of 2. The schools with the most progress last year were Chapel District Elementary (1.14 SPI and Strand 1) and St. Michaels Elementary (1.11 SPI and Strand rating of 1). Easton Middle School was at the bottom of the list with an 0.906 SPI and Strand 3 category.
The School Progress Index (SPI) and the school’s result on each of the Indicators of the Index will give the school a very clear picture of their progress to meeting targets. Once the School Progress Index is calculated (with values of 0 to 1 or greater), the scores will be broken into five strands for identifying interventions, support, and recognition to schools. Schools in Strand 1 will be schools meeting all targets and schools not meeting any of their targets will likely be in Strand 5. Although schools will, as always, have very unique profiles, the Maryland State Department of Education (MSDE) will group the schools based on a measure of the magnitude of the issues these schools face when meeting their targets. This Strand categorization allows MSDE and the Local Education Agency (LEA) to differentiate resources to schools by magnitude of need while precise diagnosis occurs at the school.
The Strand rating is a particularly important one. As noted on the Maryland State Department of Education’s Report Card website, the Strand ratings are summarized below.
Strand One: If schools fall into Strand 1, the schools have a School Progress Index score of 1.0 or better and will have met their targets for Achievement, Gap, and Growth (elementary/middle schools) or Achievement, Gap, and College- and Career-Readiness indicators (high schools) per grade span. These schools are usually meeting and exceeding the academic standards for all students. Schools that score in this Strand may have met the minimum standards set by the State for closing the achievement gaps but will, through development of the School Improvement Plan (SIP), want to set even higher standards. Additionally, schools will examine the data they have that indicate any need whether academic, physical, emotional, or cultural and develop intervention plans.
Strand Two: If schools fall into Strand 2, the schools have a School Progress Index score greater than or equal to 0.9 and will have met at least two of their three targets for Achievement, Gap, and Growth (elementary/middle schools) or Achievement, Gap, and College- and Career-Readiness indicators (high schools) per grade span. The successes and challenges of schools in Strand 2 will be varied. Schools may excel at Mathematics but lag in reading or vice-versa. In this case, the balance of Achievement, Growth, Gap Reduction and College- and Career-Readiness Goals can yield relatively high-performing schools with targeted needs that, when addressed, could lead them to enter Strand 1.
Strand Three: If schools fall into Strand 3, the schools have a School Progress Index score greater than or equal to 0.9 and have met at least one of their three targets for Achievement, Gap, and Growth (elementary/middle schools) or Achievement, Gap, and College- and Career-Readiness indicators (high schools) per grade span. Strand 3 schools will show an increase in the intensity of needs identified by the School Improvement Process. Schools in Strand 3 may have multiple subgroups struggling to achieve standards or may have intensive, pervasive problems for one very low-performing subgroup. More often than for schools in Strand 2, LEAs and schools may determine the need for a systemic solution rather than, or in addition to, continued support to individual subgroups. Title I schools that fall into this Strand will be eligible to apply for 1003(a) School Improvement Grant funds to support the direction toward improvement detailed in the SIP.
Strand Four: If schools fall into Strand 4, the schools have a School Progress Index score greater than or equal to 0.9 and have not met any of their targets for Achievement, Gap, and Growth (elementary/middle schools) or Achievement, Gap, and College- and Career-Readiness indicators (high schools) per grade span. Strand 4 schools are those that are generally not meeting targets. These schools fall close to the bottom of progress for schools in the State. They are not identified as falling into the last strand but they are near that point. Rarely will these schools have focused problems with one specific subgroup. Most often, a systemic change will be necessary to address all instruction as well as those ancillary supports, like classroom management training, that can prevent other problems from interfering with instruction. Support for the improvement of instruction, the retraining of the leadership staff, and intensified outreach to families to become involved with their child’s school should be addressed by all schools in this strand and with LEA oversight. LEAs should look carefully at the existing supports in the schools to determine effectiveness of the current path to improvement. Schools with serious needs require the attention and support of the whole community and Strand 4 schools will consider intentional activities to create community involvement.
Strand Five: If schools fall into Strand 5, the schools have a School Progress Index score lower than 0.9 but may have met as many as two of their targets for Achievement, Gap, and Growth (elementary/middle schools) or Achievement, Gap, and College- and Career-Readiness indicators (high schools) per grade span. The lowest-progressing schools in the State will fall into Strand 5. Schools falling into this strand will generally display school-wide issues that require additional, differentiated services from the LEA. These schools are also going to present the most need from student services. Required supports for Strand 5 schools that are not Title I include using the School Improvement Grant (SIG) process. The SIG process provides clear needs assessments and support through the LEA Turnaround offices. Those Title I schools in this Strand may have access to additional school improvement dollars with well defined plans for improvement. All schools, Title I or non-Title I, will receive differentiated support from the LEA.
//essay-writ.org”;.
Write a Letter to the Editor on this Article
We encourage readers to offer their point of view on this article by submitting the following form. Editing is sometimes necessary and is done at the discretion of the editorial staff.