


The Spy obtains information for the above chart between 11 a.m. and 1 p.m. Statewide data is updated about 10 a.m. each day; counties may update data throughout the day until 5 p.m. Johns Hopkins updates its data throughout the day.
Key points for today
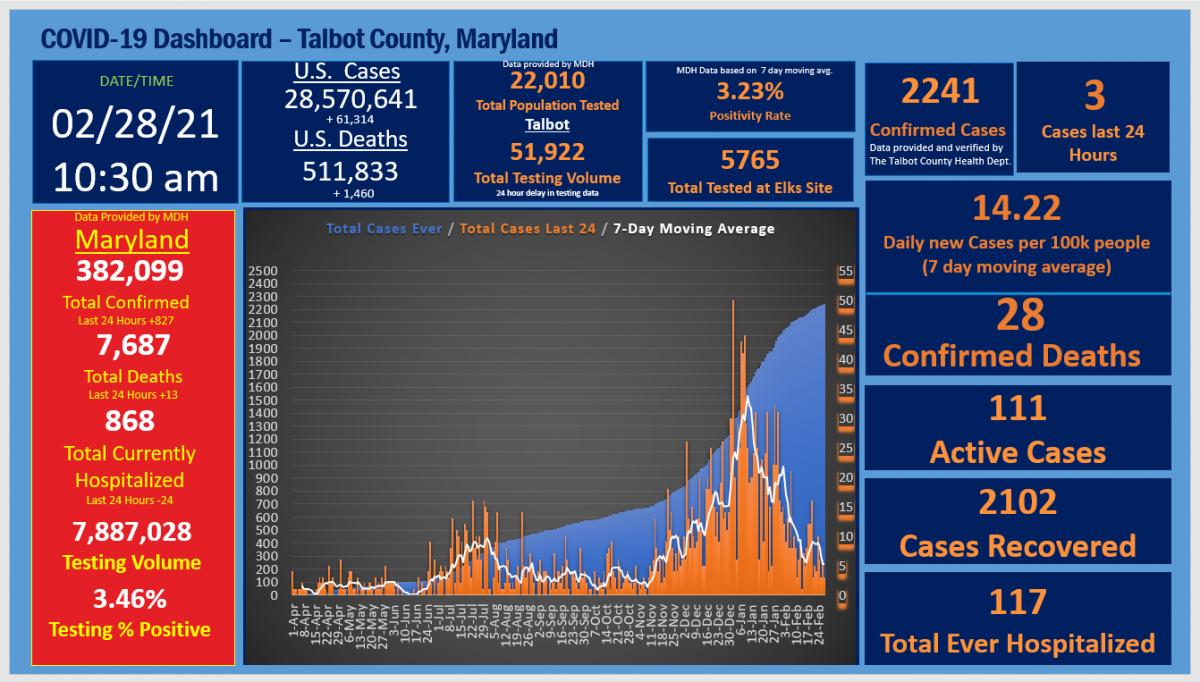
• Talbot County COVID-19 cases increased by 3 to 2,241.
• The county’s 7-day average positivity rate is 3.23%.
• The number of confirmed COVID-19 cases in Maryland is now at 382,099, an increase of 827 in the last 24 hours.
• In the last 24 hours, 13 people died as a result of COVID-19, bringing the state’s total to 7,687.
• The state’s 7-day positivity rate is 3.46% (+0.03 percentage points from yesterday).
Vaccinations
• The first dose of a COVID-19 vaccine has been given to 13.94% of Marylanders and 20.31% of Talbot County residents; second dose rates are 7.68% and 11.67% respectively.
• State Vaccine Information Page: https://coronavirus.maryland.gov/pages/vaccine
• Vaccination Site Search: https://maryland.maps.arcgis.com/apps/instant/nearby/index.html?appid=0dbfb100676346ed9758be319ab3f40c
Positivity Rate
• The state’s 7-day average positivity rate has remained below 5% for 17 straight days and has been below 4% for seven days.
Hospitalizations
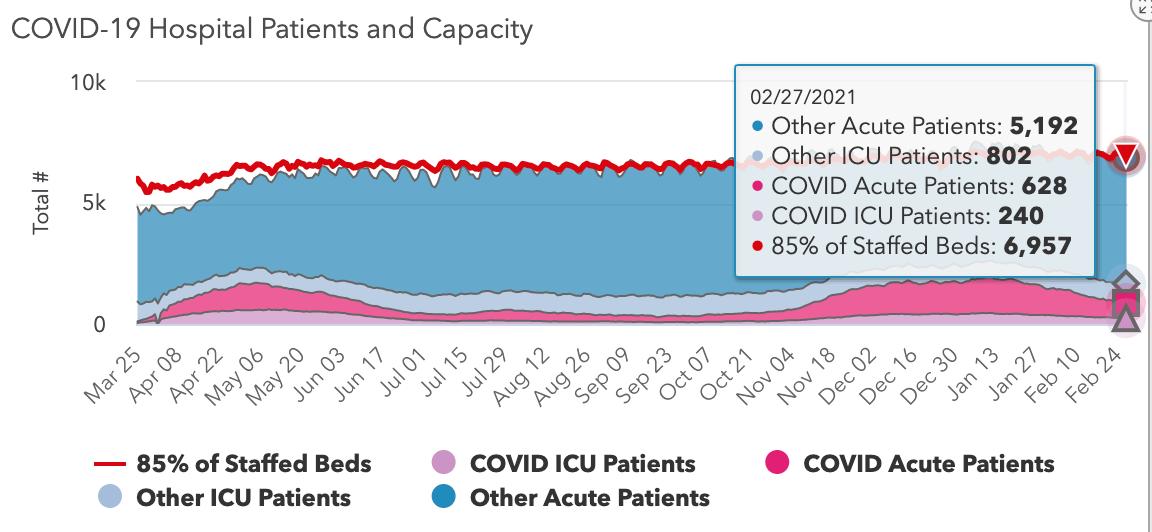
• The number of hospitalized COVID-19 patients in Maryland dropped by 24 over the last 24 hours.
• There currently are 868 people hospitalized — 628 in acute care and 240 in intensive care.
• Hospitals remained at high capacity overall yesterday, with 6,862 patients in staffed beds, slightly below the 85% capacity threshold, which was at 6,957 beds.
James P Harris says
The statistics on vaccinations imply that over 7600 residents of Talbot County have been vaccinated. Can you give us a summary of the demographics of those vaccinated. The people I know who are generally over 65 or even 70 are having a difficult time being vaccinated in Talbot County. Who’s getting the vaccines?
John Griep says
Excellent question. Maryland does provide demographics on a statewide level, but not broken down by county. The latest data for age on the state’s spreadsheets available online, based on the total number of vaccinations given by Feb. 13, shows:
AgeRange 1stDose% 2ndDose%
age80plus 14.18% 6.64%
age70to79 18.99% 8.45%
age60to69 15.86% 15.04%
age50to59 14.82% 19.90%
age40to49 13.56% 18.34%
age30to39 13.40% 18.80%
age20to29 8.71% 12.30%
age10to19 0.48% 0.52%
If you scroll down to the vaccination portion of the state’s main coronavirus page https://coronavirus.maryland.gov/, there are bar charts showing statewide vaccinations by age, gender, race, and ethnicity. Based on a calculation of the first dose totals on the by age chart, those bar charts appear to be based on up-to-date information.
For a list of all the datasets the state is currently providing (now up to 81), go to https://coronavirus.maryland.gov/search. These datasets are the basis for much of the daily COVID-19 statistics we report.