MENU

Sections

  • Home
  • About
    • Contact Us
    • Editors and Writers
    • Join our Mailing List
    • Letters to Editor Policy
    • Advertising & Underwriting
    • Code of Ethics
    • Privacy
    • Talbot Spy Terms of Use
  • Art and Design
  • Culture and Local Life
  • Public Affairs
    • Ecosystem
    • Education
    • Health
    • Senior Life
  • Community Opinion
  • Sign up for Free Subscription
  • Donate to the Talbot Spy
  • Cambridge Spy

More

  • Support the Spy
  • About Spy Community Media
  • Advertising with the Spy
  • Subscribe
June 29, 2025

Talbot Spy

Nonpartisan Education-based News for Talbot County Community

  • Home
  • About
    • Contact Us
    • Editors and Writers
    • Join our Mailing List
    • Letters to Editor Policy
    • Advertising & Underwriting
    • Code of Ethics
    • Privacy
    • Talbot Spy Terms of Use
  • Art and Design
  • Culture and Local Life
  • Public Affairs
    • Ecosystem
    • Education
    • Health
    • Senior Life
  • Community Opinion
  • Sign up for Free Subscription
  • Donate to the Talbot Spy
  • Cambridge Spy
News Maryland News

Analysis: Census Data and the Political Reordering to Come in Md.

August 16, 2021 by Maryland Matters

Baltimore City leaders knew they were coming.

And yet, the newest population numbers from the U.S. Census, delivered Thursday on the hottest day of the year, hit them like a torrent of cold water in the face.

Baltimore’s dramatic 5.7% population loss over the past 10 years means the city is sure to face a corresponding loss of political clout in the decade ahead — no matter how many allies it has in the highest echelons of power in Annapolis.

That’s one of many political threads that will be pulled over the next several months, as state politicians and policymakers seek to use the Census data as part of the recipe for congressional and legislative district maps that will be in place until the elections of 2032.

Baltimore wasn’t the only Maryland jurisdiction to see significant population losses — far from it. But the latest numbers did produce a significant degree of handwringing in the city.

Donald C. Fry, president and CEO of the business group the Greater Baltimore Committee, called it “unacceptable for a city with the many positive attributes Baltimore has, from its affordability, diversity, strong neighborhoods, historical and cultural attractions to world class healthcare and universities, to lose residents.”

Baltimore Mayor Brandon M. Scott (D) scrambled to put the dreary numbers in historical context and asserted that city leaders are putting policies in place to stanch the bleeding and slowly build back the city’s population.

“Today’s population figures are the culmination of more than 70 years of population decline, showing why we must pivot from the status quo towards inclusive economic policies that improve the lives of our legacy residents, while attracting new residents,” Scott said Thursday. “Understanding that much of Baltimore’s 21st century population loss has been driven by an exodus of African American households, my administration will be focused on equitable economic development. We can no longer leave any corner of our city behind.”

Census figures help determine how much federal aid is distributed to states and local jurisdictions, but they are also key weapons in the raw redistricting political battles that will follow.

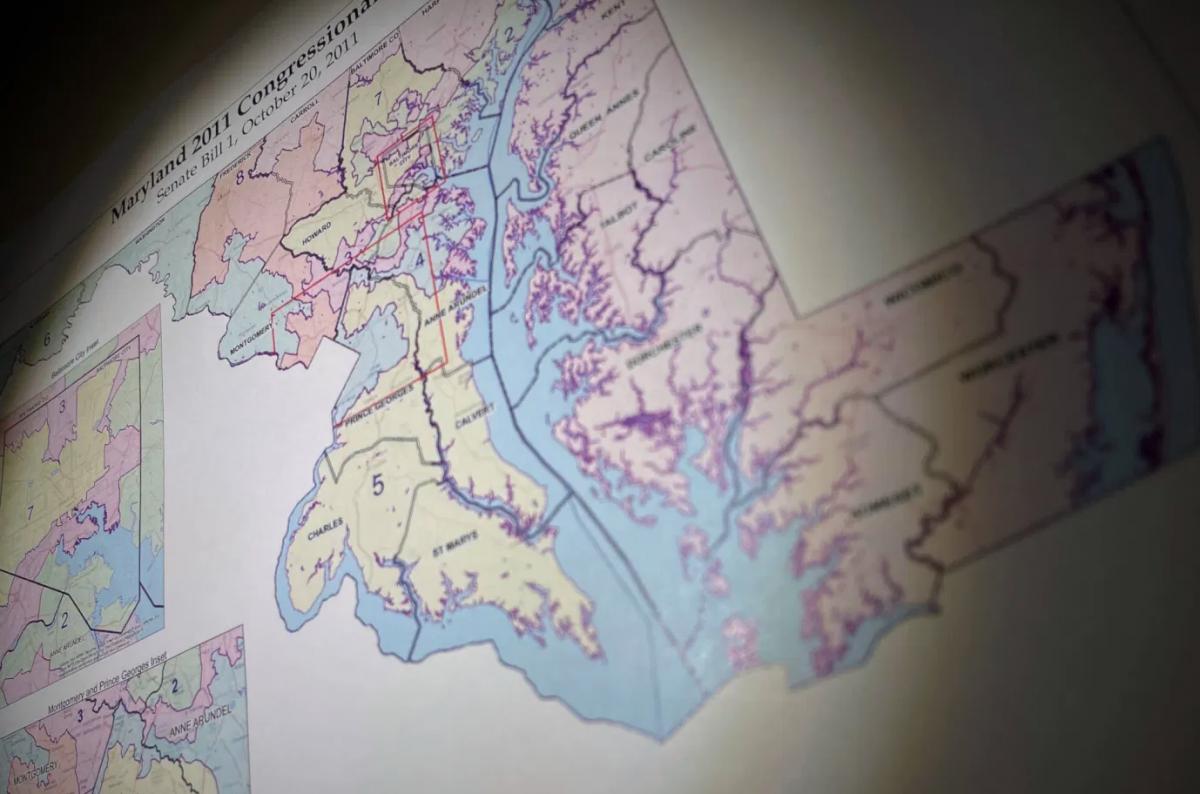
Overlaying Maryland’s current congressional and legislative district maps with the map of of the latest county-by-county population trends is an interesting exercise.

Even the most gerrymandered political maps must start at the corners of the state — far Western Maryland and the Lower Eastern Shore. And at both poles of the state, the population, with the exception of Wicomico County on the Shore, has declined over the past decade. That’s part of a national trend that saw rural population drop sharply while it increased in urban and suburban areas — and will have implications for what congressional and legislative boundaries in Maryland look like.

From the minute he took office, Gov. Lawrence J. Hogan Jr. (R) has sought to inject himself in the redistricting process — or at least take the power away from the Democratic supermajorities in the General Assembly and, by extension, the most senior Democrats in the state’s congressional delegation. But the fact remains that legislative leaders, working in tandem with U.S. House Majority Leader Steny H. Hoyer (D-Md.), will have the most say.

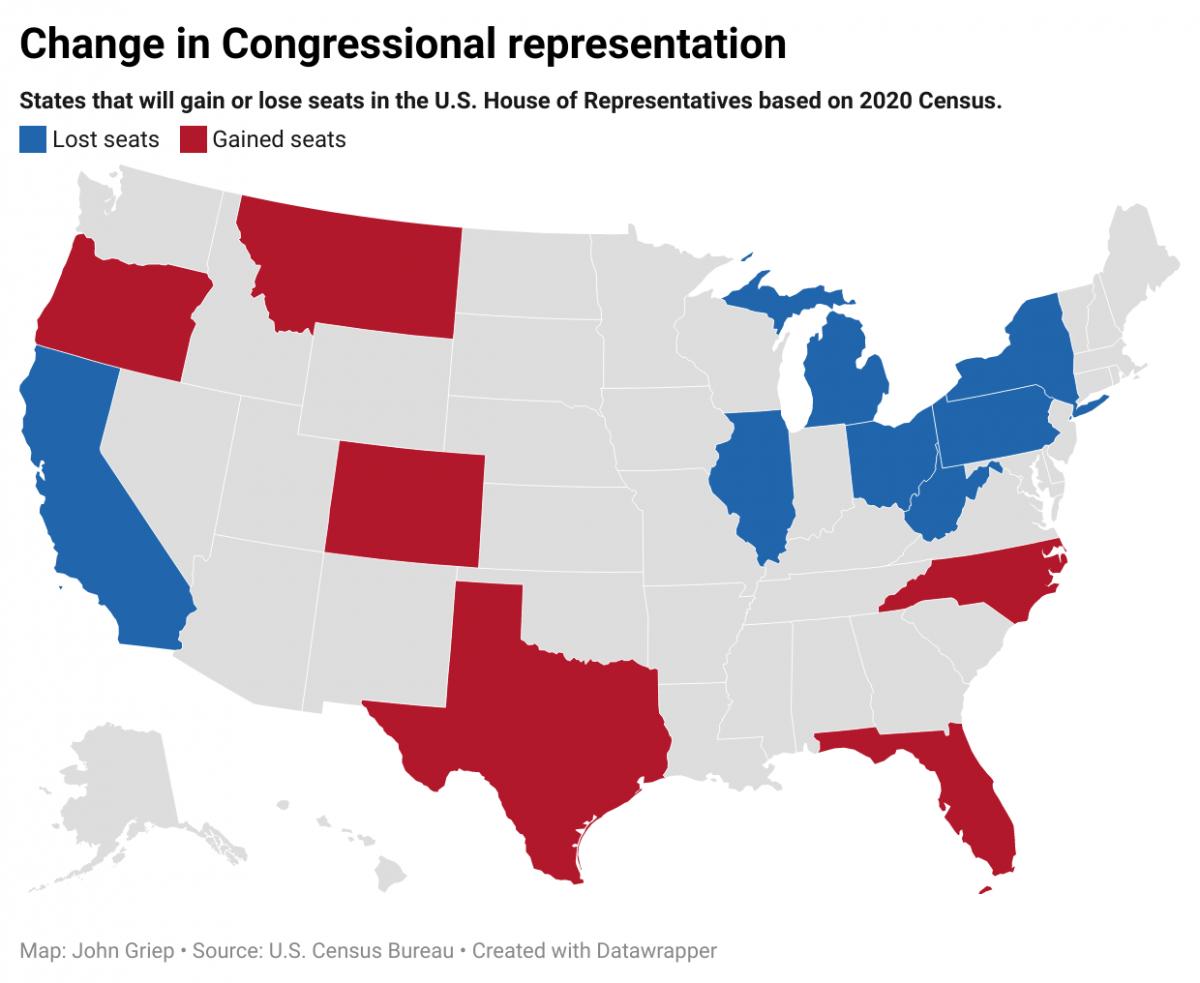
For State House Democrats, knowing that Republican legislatures will attempt to help the GOP seize control of the U.S. House of Representatives by muscling through baldly gerrymandered maps, there will be temptations to create an 8-0 Democratic congressional map in Maryland (the state delegation currently has seven Democrats and one Republican). But the Census figures show that population trends in certain red states weren’t as stark as they could have been — meaning Republicans won’t have quite as much power to bludgeon Democrats in those places as they might have expected.

“Early read: based on the strong urban and weaker rural numbers I’m seeing, this is a much more favorable Census count than minority advocacy groups/Dems had feared,” Dave Wasserman, the House analyst for the nonpartisan Cook Political Report tweeted Thursday.

As a result, Maryland Democratic strategists believe, party leaders are more likely to try to produce a 7-1 Democratic congressional map again — albeit one that is cleaner, with fewer tortured contours, and that is less susceptible to lawsuit than the post-2010 Census map.

Baltimore City currently has three congressional districts cutting through its borders. Anne Arundel County has four. Howard County has three. Baltimore County has four. The result is messy, nonsensical districts in the central part of the state. That may change.

With population losses on the Eastern Shore, the 1st Congressional District, held by the state’s lone Republican member of Congress, Rep. Andrew P. Harris, will probably need to gain more territory on the western side of the Chesapeake Bay. Where those precincts are added may determine how competitive a re-election race Harris will face in 2022 — most likely against former state Del. Heather R. Mizeur (D).

Maryland mapmakers actually have more flexibility when it comes to drawing legislative districts — where population variations of as much as 10% are permissible (each congressional district must contain the exact same population, to the extent possible). Even so, Baltimore City, which has steadily lost representation over the past few decades, is likely to lose more seats.

It’s already accepted wisdom in Annapolis that the 44th District, which currently contains a one-member House subdistrict in Baltimore City and two House seats in Baltimore County, will push out into the county exclusively — meaning the legislative tenure of Roxane Prettyman (D), who has been recommended by the Baltimore City Democratic Central Committee to fill a vacancy in District 44A, could be short-lived.

Another Baltimore City legislative district that has seen modest population growth, District 46, may have to lose some city precincts to make whole other city districts — and could extend south toward Glen Burnie or even BWI Thurgood Marshall Airport.

Howard County’s population growth means it may no longer have to share one legislative district with Baltimore County. Frederick County’s population growth means it may not have to share a legislative district with Carroll County. Southern Maryland’s representation in Annapolis is also likely to grow — though Democrats undoubtedly will try to maximize their advantage in fast-growing Charles County, which, according to the latest Census figures, is now over 50% Black.

And population losses in Garrett and Allegany counties mean the 1st legislative district will necessarily have to push farther east into Washington County.

The Maryland Department of Planning will now take the Census figures and spend the next few weeks adjusting them to account for the state’s incarcerated population. Under state law, incarcerated individuals are countered as residents of the jurisdictions where they previously lived, rather than the jurisdiction of the prisons where they are serving their sentences. This could help limit Baltimore City’s population loss to a small degree.

Hogan and legislative leaders are relying on the work of dueling redistricting commissions to help guide them on the maps they will propose in an upcoming special session of the General Assembly to finalize a congressional map, and during the regular 2022 session when legislative lines must be adopted. Even though Democrats have the upper hand, Hogan was already attempting to grab the moral high ground on Thursday.

“All across our state, Marylanders are demanding an end to partisan gerrymandering from partisan politicians in the legislature and supporting the work of the independent and nonpartisan Maryland Citizens Redistricting Commission,” he said on Twitter.

By Josh Kurtz

The Spy Newspapers may periodically employ the assistance of artificial intelligence (AI) to enhance the clarity and accuracy of our content.

Filed Under: Maryland News Tagged With: 2020, census, congressional, districts, gerrymandering, legislative, Maryland, redistricting

Maryland Will Keep 8 Seats in U.S. House, Census Officials Say

April 27, 2021 by Maryland Matters

Maryland will keep its eight seats in the House of Representatives in the next round of redistricting, Census Bureau officials announced Monday.

Maryland joins 36 other states keeping the same amount of U.S. Representatives during the next round of redistricting.

For six states, the long-awaited census results mean they’ll gain representation in Congress: Fast-growing Texas will add two seats, and five states will each add one seat: Florida (which surpassed New York to become the third-largest state), North Carolina, Colorado, Montana and Oregon.

Because the House must remain at 435 lawmakers, seven states will have fewer representatives, after either losing population over the last 10 years or not growing as quickly as other states. New York, California, Illinois, Michigan, Ohio, Pennsylvania, and West Virginia all will see their federal delegations shrink by one legislator starting in 2023.

Overall, there were 331,449,281 people living in the U.S. on April 1, 2020, an increase of 7.4% since 2010. That’s the slowest growth in a decade since the 1930s, and the second-slowest growth rate in U.S. history.

Maryland had a population of 6,177,224 in the 2020 Census, according to the newly released data, representing a 7% increase since 2010. That’s a drop from the 9% increase the state saw between 2000 and 2010, according to the data.

The apportionment changes, including population totals, are the first round of data to be released from the 2020 census.

Block-by-block population data that state officials need to draw districts of equal size will be released by Aug. 16 as an untabulated “legacy format summary file,” according to a Census Bureau release.

Although that data will be available as a legacy format summary file in mid-August, some states might be faced with an even longer wait for specific results. According to a separate release from the Census Bureau, “most states lack the capacity or resources to tabulate the data from these summary files on their own,” and tabulated data will be available by Sept. 30.

Even after Maryland officials receive the data, it will need to be adjusted to comply with Maryland law and have incarcerated individuals reallocated to their last known address, according to the Maryland Department of Planning website. State officials estimate that process will take at least an additional 30 days before the redistricting data is finalized.

Census officials originally planned to get redistricting data to states by March 31, but that date was pushed back after the COVID-19 pandemic waylaid their counting process.

Those delays could put Maryland lawmakers — and candidates for Congress and the General Assembly uncertain whether they’ll still be living within a district’s boundaries — on a time crunch: While Maryland law doesn’t set a strict deadline for drawing congressional districts, state legislative districts must be proposed by Gov. Lawrence J. Hogan Jr. (R) to the General Assembly by Jan. 12, 2022. Those recommendations will become law unless lawmakers tack on their own changes by Feb. 26.

The candidacy deadline for Republican and Democratic congressional and legislative hopefuls is Feb. 22, 2022.

In 2010, the General Assembly met in a special session in October to approve congressional district lines.

Some states with even tighter deadlines written into law might have to change their redistricting laws to cope with the delays, according to a Brennan Center Analysis.

Hogan’s multi-partisan Maryland Citizens Redistricting Commission, which he created via executive order earlier this year, is currently mulling how to work around the Census delays, commission co-chair Walter Olson (R) told Maryland Matters.

“It’s going to mean that we get hard, usable numbers months later than we would have hoped,” Olson said, adding that working around the Census delay will be among the commission’s top agenda items.

“The goal is to get as much work as we can done, including many hearings, before the Census Bureau comes through,” Olson said.

The redistricting commission, which earlier this month announced its full membership, will conduct public hearings in the coming months before making final recommendations to Hogan. They’ll aim to recommend geographically compact districts that aren’t meant to favor any party over another – and will also consider dividing state legislative maps into single-member districts.

Defending the census process

Typically, the state-level population data released Monday would have been provided by the end of December, but that process was delayed due to the COVID-19 pandemic.

The census tallies how many people are living in the U.S. on April 1, and last year, that date fell shortly after states had issued lockdown orders aimed at curbing spread of the coronavirus. That scrambled plans for following up door-to-door with those who did not fill out the form.

“We advertised on pizza boxes, instead of during basketball games,” said Ron Jarmin, acting director of the Census Bureau. “Our partners joined us in reaching people at food banks and in school cafeterias, instead of promoting the census at county fairs.”

Other Americans became harder to reach due to wildfires and hurricanes. The Trump administration also interfered in the counting process, pursuing policies that some feared would make immigrants less likely to respond and cutting the operation short.

As they announced the new population figures, Census officials defended the accuracy of the counting process, saying the delayed door-to-door follow-ups allowed for more complete responses.

While the final numbers show a slower growth rate than what had been projected, affecting the final allocation of legislative seats, the population numbers for most states were still within 1% of the bureau’s estimates.

Under the new congressional districts, which will go into effect for the 2022 elections, each member of the House will represent an average of 761,000 residents.

The biggest population gains regionally were in the South and the West, with Southern states growing by 10.2% and Western states by 9.2%. The Northeast grew by 4.1%, and Midwestern states showed a 3.1% rise in population.

That followed trends underway since the 1940s, with 84 House seats shifting South and West during that time frame, Census officials said Monday.

By Bennett Leckrone and Laura Olson

The Spy Newspapers may periodically employ the assistance of artificial intelligence (AI) to enhance the clarity and accuracy of our content.

Filed Under: Maryland News Tagged With: 2020, census, House of Representatives, Maryland, redistricting

In an Anxiety-Ridden Year, U.S. Voter Turnout Rate Highest Since 1900

November 9, 2020 by Capital News Service

More people voted in this year’s election than ever before, some motivated by fear, some by peer influence, some by the wide options available for voting, some by social media and still others by love or hate for President Donald Trump.

As of Thursday, an estimated 159 million people, accounting for 66.4% of the eligible voting population, cast ballots in this election, according to the University of Florida’s United States Elections Project. That exceeds the turnout percentages for the past 120 years, going back to the 1900 race, when 73.2% of the voting eligible population cast ballots, ultimately re-electing President William McKinley over Democratic challenger William Jennings Bryan.

“High turnout is a sign of a healthy democracy,” Michael McDonald, who runs the Elections Project, wrote in USA Today on Wednesday.

He also pointed to a pre-election Gallup Poll in which 77% of registered voters said the 2020 election mattered more to them than previous elections – the highest level since the polling firm started asking that question in 1996. Still, over one-third of voting eligible people did not cast a ballot in this election.

Experts say fear of the ongoing coronavirus pandemic and about the economy, strong feelings about Trump, the current social climate and peer influences, among other factors, spawned this historic turnout. And many states still are tabulating ballots.

Following an established pattern since at least 2000, turnout rates were especially high in key swing states. Over 75% of eligible voters cast ballots in Wisconsin, New Hampshire, and Iowa, while over 70% of eligible voters did so in Ohio, Michigan, North Carolina and Florida. Georgia received ballots from just under 70% of eligible voters.

“There’s a couple of things going on there,” said Michael Hanmer, research director of the University of Maryland’s Center for Democracy and Civil Engagement.

“The feeling that something more is at stake could be part of the internal motivator” for individual voters, Hanmer said, in states where, because of the Electoral College system, a vote for Trump wouldn’t have much impact in a state that voted Democratic, and a vote for Biden wouldn’t count for much in a state that voted Republican.

Voters in the battleground states don’t have that concern. Campaigns spend more energy and money in states that could go either way.

“It’s harder in those states to ignore what’s going on. It’s going to be on TV, it’s going to be on radio, it’s more likely to be on their social media, they’re more likely to get a door knock,” Hanmer said.

Non-swing states with especially high turnout rates, estimated by the Elections Project, were Maine, Minnesota, Colorado, Washington and Oregon – all saw three-quarters or more of their eligible voters cast ballots. Maryland ranked fifteenth in voter turnout, with just over 72% of eligible voters, according to the Elections Project estimates.

The availability of mail-in voting and early voting due to the coronavirus pandemic may have contributed to high turnout in some states. In Maryland, about half of the state’s voters mailed in their ballots.

Historically, states that regularly conduct elections by mail, such as Oregon, have greater voter turnout than those states that traditionally do not use the mails for balloting.

In Pennsylvania, where ballots still were being counted, Secretary of State Kathy Bookvar told reporters Thursday that she expected a very high turnout in the battleground state.

“Pennsylvanians have had more choices this year than in the history of the commonwealth,” she said.

Hanmer said that voting law changes to accommodate the pandemic likely generated some turnout, but added that since even many states that did not make these changes, like Texas, saw increased turnout, there were other factors at play as well.

“I really think that the turnout story for this election is more about general interest and mobilization,” Hanmer said.

The pandemic may have been responsible for some of this mobilization: “We’ve had our lives upended and we’re in this environment where our physical social circles have largely shrunk, and we’re really hard pressed to avoid coverage of what’s going on in the news,” Hanmer said.

David Paleologos, director of Suffolk University’s Political Research Center, said usually “what increases voter turnout is the quality of the candidates,” but this year is historic in that high voter turnout seemed to be primarily motivated by fear.

“it’s just ironic to me that Joe Biden … has the ability to get the most votes, ever, ever, and he’s not the person that people are excited about,” Paleologos said.

Memories of Hillary Clinton’s loss in 2016 may also have spurred additional turnout for Biden.

“People didn’t get out to vote because they assumed she was going to win,” Paleologos said, adding that there wasn’t “that element of surprise” this time around.

Hanmer also suspects social media and peer influence contributed to the high turnout.

“A lot of people were engaged this year in contacting other people, and I mean just regular people contacting their friends, not necessarily always part of some wider formal campaign activity,” Hanmer said. “That’s just been increasingly common as a tactic.”

Alexandra Palm, a 24-year-old nanny and pizza deliverer in Spokane, Washington, said she did not want to vote this year, but was shamed into casting a ballot for Biden.

“On social media is where I felt shamed a lot,” Palm said. She said that it wasn’t usually personally directed toward her, but “if I ever brought up that I was not voting, there was never a time when someone would just ever respect that decision, ever.”

Instead, she said people told her she couldn’t complain about election results if she didn’t vote, and that if she didn’t vote for Biden it counted as a vote for Trump. Her father and people on social media told her “you have to vote, you have to vote, you have to vote,” she said.

Ralph Watkins, a volunteer with the League of Women Voters, said “just the tone overall seemed to be far stronger than in many recent elections.”

“Democrats were very passionate about wanting to turn (Trump) out of office, and many Republicans were equally passionate about wanting to keep (Trump) in office,” Watkins said.

Watkins said the pandemic and the resulting economic downturn generated turnout along party lines: those who worried more about the economy tended to vote Republican, while those who worried more about the pandemic tended to vote Democrat.

Additionally, “concerns about racism are really critical, and turnout in African American areas was very high and very democratic,” Watkins said.

Marqus Shaw, 35, of Oklahoma City, voted for Biden — his first time voting. He said it was mainly to vote against Donald Trump.

“(Biden)’s better than Trump to me,” Shaw said. “Trump just says things that you shouldn’t say, he shows no compassion, and he’s a racist.”

In the past, Shaw said, he has felt like his vote wouldn’t matter, but this year he said he “just can’t take Trump anymore.”

Paleologos said turnout driven by fear “doesn’t bode well for the system at large” and may indicate a failure of the party system.

“If we’re going to have two parties, the key is for the party system to enable and support candidates who have broad appeal,” he said. “Right now we don’t have that. Right now the party system thrives on negativity.”

By Gracie Todd and Luciana Perez Uribe

The Spy Newspapers may periodically employ the assistance of artificial intelligence (AI) to enhance the clarity and accuracy of our content.

Filed Under: Maryland News Tagged With: 2020, ballots, Biden, Economy, election, pandemic, Trump, voter turnout

Mayor, Ward 2, and Ward 3 Races in Cambridge Head to Dec. 1 Run-Off Elections

October 20, 2020 by Spy Desk

Roche earns Ward 1 seat, Cephas wins in Ward 4, Malkus unopposed in Ward 5

Cambridge Mayor Victoria Jackson-Stanley will face Andrew Bradshaw in a Dec. 1 run-off election.

The incumbent mayor got 40.62% of the vote on Oct. 17, Bradshaw had 27.79%, La-Shon Banks Foster had 19.27%, and Robert S. Larimer had 12.32%.

Since no mayoral candidate won 50%+1 of the vote in the first round, the two candidates with the highest vote counts move on to the run-off election. The same process occurred in Wards 2 and 3.

In Ward 2, incumbent Commissioner Donald Sydnor (38.84%) will face Lajan Natasha Cephas (30.28%) in the run-off election. Paul F. Baiers Jr. had 16.93% of the vote and Tyzann Meekins had 13.94%.

In Ward 3, Gary T. Gordy (39.24%) and Jameson Harrington (30.59%) move on to the run-off election. Harrington barely edged out Duane Farrow, who had 30.17% of the vote. Harrington had 144 votes to 142 for Farrow.

Brian Roche, with 61.59% of the vote, was elected commissioner in Ward 1. Sharon B. Smith had 26.81% and Tom Bradley had 11.59%.

With only two candidates in Ward 4, Sputty Cephas (51.14%) narrowly defeated incumbent Dave Cannon (48.86%).

Chad Malkus was unopposed in Ward 5.

Election officials verified the results of the Saturday election on Monday, beginning the process at 10 a.m.

The Dec. 1 run-off election will be held from 7 a.m. to 7 p.m. at the Chesapeake College center in downtown Cambridge. It will be a mail-in election, with all previously registered voters being mailed a ballot during the first week of November. Voted ballots may be returned by mail or dropped off on Dec. 1 at Chesapeake College.

City Manager Patrick Comiskey will discuss the election at 7 p.m. Wednesday, Oct. 21. View the program here: https://www.youtube.com/watch?v=KTChlDYAnxg

The Spy Newspapers may periodically employ the assistance of artificial intelligence (AI) to enhance the clarity and accuracy of our content.

Filed Under: 2 News Homepage Tagged With: 2020, Cambridge, council, election, mayor, run-off

Copyright © 2025

Affiliated News

  • The Chestertown Spy
  • The Talbot Spy

Sections

  • Arts
  • Culture
  • Ecosystem
  • Education
  • Mid-Shore Health
  • Culture and Local Life
  • Shore Recovery
  • Spy Senior Nation

Spy Community Media

  • Subscribe
  • Contact Us
  • Advertising & Underwriting

Copyright © 2025 · Spy Community Media Child Theme on Genesis Framework · WordPress · Log in